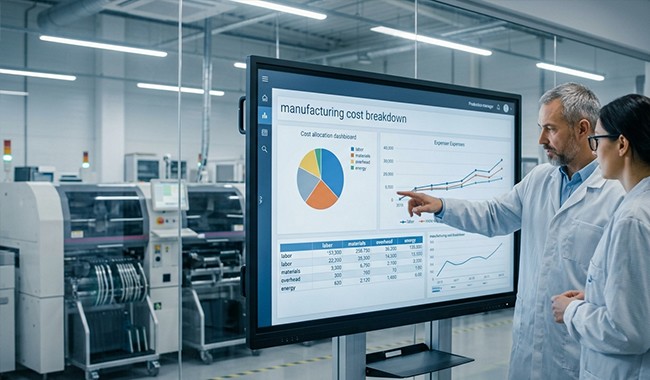
Not Sure About Your Unit Cost or Manufacturing Overhead?
A manufacturing investment can look profitable when the supplier quotation and expected selling price are viewed in isolation. The problem usually appears later, when tooling, development, quality control, packaging, logistics, inventory, financing, and other operating costs enter the actual economics. A manufacturing ROI calculator is useful only when these variables are defined consistently. Otherwise, the calculation can produce a precise-looking result from incomplete assumptions.
For B2B decision-makers, the objective is not simply to calculate a return. The objective is to determine whether the proposed product, sourcing plan, or manufacturing investment remains commercially viable after its full cost structure is considered. A total manufacturing cost calculator, manufacturing cost calculator, production cost calculator, and product pricing calculator each address different parts of that decision. Proper manufacturing cost analysis must connect them to COGS, overhead, pricing, investment, and expected returns.

Why Manufacturing ROI Estimates Often Fail Before Production Starts
The most common failure is treating the supplier’s unit quotation as the economic cost of the project. A quotation may represent the factory’s production price under a specific MOQ, specification, packaging configuration, payment term, or production volume, but it does not necessarily represent the total cost required to bring the product to market. A buyer can therefore obtain a competitive factory price while still committing to an unattractive project. This is why manufacturing financial analysis needs to distinguish the supplier price from the complete cost structure before an ROI result is accepted. A structured B2B sourcing platform can help decision-makers connect supplier information with product specifications, sourcing conditions, and downstream cost assumptions rather than evaluating a quotation in isolation.
The gap becomes larger when costs are added at different stages of execution. Prototype development, tooling, engineering changes, certification, packaging development, inspection, rework, freight, duties, inventory, and payment terms may not appear in the initial quotation. Some costs are fixed investments, while others increase with every unit. Treating both categories as a single unit cost can distort break-even volume and expected return. A sound manufacturing cost analysis therefore needs to establish which costs are recurring, which are one-time investments, and which depend on production or sales volume. In practical supply chain sourcing, this distinction is especially important when comparing suppliers or production locations because a lower EXW price can be offset by higher tooling, logistics, MOQ, inventory, or compliance costs.
Another recurring error is separating cost assumptions from commercial assumptions. A projected selling price may be based on competitor listings or an initial market study, while the production estimate is based on a preliminary supplier quote. If either assumption changes, the ROI changes with it. For example, a lower achievable market price can reduce gross margin even when the factory maintains its quoted cost. Conversely, increasing production volume may reduce unit manufacturing cost but create additional inventory exposure if demand does not materialize. ROI should therefore be treated as a scenario-dependent decision measure, not as a fixed property of the product.
The practical consequence is that an ROI calculation should be used as a validation gate rather than a final justification. Before committing capital, the decision-maker needs to establish whether the underlying cost, volume, pricing, and investment assumptions have been validated sufficiently for the decision being made. If supplier costs are still provisional, market demand is untested, or major compliance and development requirements are unknown, the calculator can identify the uncertainty but cannot eliminate it. The correct response may be to gather better sourcing data through a B2B sourcing platform, revise the product specification, or test alternative production scenarios before approving the investment.
What Should You Define Before Using WIDQ’s Manufacturing ROI Calculator?
Before entering the calculator, define the commercial assumptions that are most likely to change the investment decision. The objective is not to have every supplier quotation or engineering specification confirmed. At an early sourcing stage, some values will necessarily be estimates. What matters is knowing which values are confirmed, which are supplier-dependent, and which are market assumptions. A forecast of 10,000 units per year, for example, should not be treated as an operational commitment if it comes only from an initial market estimate. The same applies to target retail price, gross margin, product lifecycle, and tax assumptions. Separating known inputs from assumptions makes the resulting manufacturing ROI calculation easier to validate and update when better information becomes available.
The first inputs should establish the project’s commercial baseline. WIDQ asks whether the project is a new product moving from concept to mass production, an existing design requiring tooling and manufacturing support, or an OEM/ODM customization project. This distinction matters because the expected development work, tooling requirements, production assumptions, and investment exposure can differ substantially between project types. You should then define the product’s dimensions, weight, expected market lifecycle, annual sales forecast, target retail price, target gross margin, and effective tax rate. These values create the boundary conditions for the subsequent cost and financial model. If one of them is unrealistic, improving the precision of later manufacturing cost analysis will not correct the underlying commercial assumption.
The next step is to identify the information you already have and the information that still requires validation. A supplier may have provided an EXW quotation but not confirmed tooling cost, packaging, production capacity, certification requirements, or logistics. Conversely, an existing product may have reliable dimensions and specifications but an uncertain sales forecast. Do not force uncertain information to appear more precise than it is. The calculator is more useful when its assumptions can later be replaced with supplier quotations, engineering data, validated demand estimates, or actual logistics costs. This creates a working financial model rather than a one-time cost estimate.
A practical preparation check is therefore:
| Input area | What to define | What happens if it is unreliable |
|---|---|---|
| Project type | New product, existing design, or OEM/ODM | Development and tooling assumptions may be misaligned |
| Product specifications | Dimensions, weight, materials and complexity | Unit manufacturing and logistics estimates can shift |
| Sales forecast | Expected annual volume and lifecycle | MOQ, amortization and ROI may be overstated |
| Target retail price | Expected market selling price | Revenue and margin calculations may become unrealistic |
| Gross margin | Commercial margin target | Pricing and investment feasibility may be misjudged |
| Tax rate | Effective applicable tax assumption | Net financial results may be distorted |
The key decision is not whether every input is final. It is whether the current inputs are sufficiently credible to support the next decision. If they are not, the correct action may be to validate the product specification, request supplier data, conduct further market research, or refine the sales forecast before treating the ROI result as an investment signal.
How to Use WIDQ’s Manufacturing ROI Calculator Step by Step
WIDQ’s calculator is structured as a five-stage workflow: Project Definition, Core Specifications, Technical Process, Financial Model, and Final Report. Each stage adds another layer to the commercial model. The practical approach is to treat the calculator as a progressive decision process rather than entering numbers simply to obtain an ROI percentage. Early assumptions establish the model, technical inputs build the cost structure, financial inputs connect the project to its commercial model, and the final report shows whether the combined assumptions remain viable.
1. Start with Project Definition
Select the project type that most closely represents the current manufacturing objective. The three options are:
- Developing a new product from concept to mass production
- Working from an existing product design or prototype and requiring tooling and manufacturing support
- Developing an OEM/ODM customization based on an existing product category
This selection establishes the context for the subsequent analysis. A concept-stage project generally carries more development uncertainty than an existing design that has already been technically validated. An OEM/ODM project may reduce certain development requirements while introducing customization, tooling, MOQ, or certification considerations. Selecting the wrong project type can therefore create an inappropriate cost and investment baseline before any detailed calculation begins.

2. Enter the Core Product and Commercial Assumptions
The Core Specifications stage establishes the physical and commercial baseline. Enter the product dimensions and other required specifications, then define the expected market lifecycle, annual sales forecast, target retail price, target gross margin, and effective tax rate.
These inputs should be treated as connected variables rather than independent fields. For example, a higher annual sales forecast can improve tooling and development cost amortization, but it also creates a larger inventory and working-capital requirement if the forecast leads to a larger initial production commitment. Similarly, a target retail price may support a required gross margin on paper but become commercially unrealistic if the market cannot sustain that price.
The purpose of this stage is therefore not to produce a final answer. It establishes the assumptions against which the technical and financial model will be tested.

3. Define the Technical and Manufacturing Requirements
The Technical Process stage converts the product concept into a more complete manufacturing cost structure. WIDQ evaluates the areas that can create material differences between a supplier’s apparent unit price and the project’s actual investment requirement.
The calculation considers:
- Product engineering and material structure
- Mold and tooling requirements
- Product development and certification
- Mass production conditions
- Packaging and branding
- Quality control and operational risk
- Logistics and trade costs
This is where a basic production cost calculator becomes less useful for a complex B2B project. A unit quotation may represent only the manufacturing price, while the project also requires tooling, certification, packaging, inspection, freight, customs-related costs, and other project-specific investments. WIDQ brings these components into the same model so that the commercial decision is not based on one isolated supplier number.

4. Build the Financial Model
The Financial Model connects the manufacturing assumptions with the sales and pricing structure. At this stage, the calculator evaluates how production volume, target selling price, gross margin, channel assumptions, investment requirements, and cost structure interact.
The important distinction is between cost efficiency and project viability. Reducing a unit manufacturing cost does not automatically improve the project if the reduction requires a higher MOQ, longer lead time, additional tooling, or greater inventory exposure. Likewise, increasing the target selling price may improve the calculated margin but does not prove that the market will accept the price.
This is why the calculator should be used to test commercially plausible scenarios rather than a single optimistic case. If supplier quotations or market evidence change materially, update the relevant inputs and run the calculation again rather than relying on the original result.

5. Review the Final Report as a Decision Record
The Final Report consolidates the technical and financial assumptions into measurable outputs. Depending on the project, this can include estimated development cost, material cost, tooling cost, MOQ, production capacity, lead time, packaging cost, quality and risk cost, logistics cost, minimum viable retail price, break-even volume, working capital, total initial investment, fully allocated cost, annual profit, payback period, and ROI.
Do not judge the project from the ROI percentage alone. A project showing a high ROI can still require more working capital than the business is prepared to commit, depend on an aggressive sales forecast, or face production constraints that make the forecast difficult to execute. The useful question is whether the cost assumptions, operational requirements, capital exposure, and commercial assumptions support the same conclusion.
A practical workflow is:
Define the project → enter product and market assumptions → model technical requirements → connect costs with sales and pricing → review the financial and manufacturing feasibility report → validate material assumptions → recalculate before committing.
This makes the calculator useful beyond an initial estimate. When supplier quotations, specifications, production volumes, or market conditions change, the same model can be updated rather than rebuilding the analysis from scratch.

How WIDQ Builds the Manufacturing Cost and Investment Model
WIDQ does not treat manufacturing cost as a single supplier quotation. The model separates the costs that arise from developing the product, preparing it for production, manufacturing each unit, protecting quality, preparing it for sale, and moving it to the target market. This matters because two projects can have the same quoted unit price but require very different amounts of upfront capital. A product with relatively low unit production cost may still require expensive tooling, certification, packaging setup, or a larger first production run. The calculator therefore evaluates both recurring unit economics and project-specific investment before determining whether the expected commercial return is supported by the underlying cost structure.
The Technical Process stage is where these cost drivers are progressively defined. Product engineering and material structure influence material consumption, part complexity, scrap assumptions, and the resulting manufacturing cost. The Mold System estimates tooling requirements using factors such as cavity count, mold life, and steel grade, allowing tooling expenditure to be considered together with its expected production volume rather than treated as an unrelated one-time quotation. Product development and certification then account for engineering validation, prototyping, and market-specific compliance requirements. This distinction is important when comparing suppliers because a low manufacturing quotation can become less attractive if it excludes development work or mandatory certification that the buyer must fund separately.
The model then extends into the operational requirements of mass production. Batch size, production capacity, labor intensity, production cycle, and facility efficiency affect whether the expected unit economics can actually be achieved at the intended scale. Packaging and branding are evaluated separately because packaging affects both product cost and logistics efficiency. Quality Control & Risk introduces inspection and potential rework or scrap costs, while Logistics & Trade bridges the manufacturing price to the cost of getting the product into the target market. These components allow the analysis to identify where a seemingly competitive sourcing option may create additional capital exposure or execution risk.
The resulting structure can be viewed as a progression from product requirements to commercial investment:
| Cost and investment layer | What WIDQ evaluates | Decision it supports |
|---|---|---|
| Engineering & materials | Material cost, complexity and production structure | Is the product technically economical to manufacture? |
| Tooling | Mold requirements, life, grade and tooling investment | Is the required CAPEX justified by expected volume? |
| Development & certification | Engineering, prototyping and compliance | What must be funded before mass production? |
| Mass production | MOQ, capacity, cycle time and production efficiency | Can the planned volume be produced economically? |
| Packaging & branding | Packaging materials and setup requirements | Does the finished product remain commercially efficient? |
| Quality & risk | Inspection, rework and scrap exposure | What operational costs should be reserved? |
| Logistics & trade | Freight, Incoterms, duties and distribution | What is the cost beyond the factory gate? |
This structure is particularly useful when supplier quotations are still incomplete. Instead of waiting until every cost is known, a buyer can establish a working model, identify the assumptions with the greatest financial impact, and replace estimates with validated supplier or logistics data as the project progresses. The purpose of the model is therefore not to claim that every early estimate is exact. It is to make the cost structure visible enough to show which assumptions can materially change the investment decision.
How WIDQ Calculates COGS, Landed Cost, and Fully Allocated Cost
The Final Report separates several cost levels because they answer different B2B questions. A manufacturing quotation may tell you what the factory charges for production, but that figure does not necessarily represent the cost of selling the product in another market or recovering the investment required to develop it. WIDQ therefore distinguishes production cost, logistics and landed cost, and fully allocated cost rather than treating them as interchangeable measures. This prevents a common sourcing error: using the lowest factory quotation as if it were the economic cost of the complete project.
The production cost represents the recurring cost of manufacturing the unit, including the underlying material, labor, factory overhead, and assembly assumptions. This provides the baseline for COGS cost of goods sold before project-specific development and tooling investments are allocated. Landed cost then extends the calculation toward the destination market by incorporating logistics and trade-related costs. Depending on the project assumptions, this can include freight mode, Incoterms, customs duties, and distribution-related expenses. The distinction is commercially important because a supplier with a lower EXW price may not produce a lower landed cost if freight, duties, packaging volume, or other downstream costs are materially higher.
Fully Allocated Cost goes one step further. It incorporates manufacturing together with the applicable allocation of project investments such as R&D, tooling, packaging setup, and other development-related costs. This produces a broader view of the amount that must effectively be recovered through sales to make the project commercially viable. For example, a product may have a production cost of $2.40-$3.60 per unit while its fully allocated cost is $2.90-$4.40. The difference is not necessarily a manufacturing inefficiency. It reflects costs that must be recovered across the expected production volume. If the actual sales volume falls substantially below the forecast, those fixed or semi-fixed investments are spread across fewer units and the economics change.
The distinction can therefore be used at different stages of a sourcing decision:
| Cost measure | Primary question | Typical decision use |
|---|---|---|
| Production cost | What does it cost to manufacture one unit? | Supplier and manufacturing comparison |
| COGS | What production cost should be associated with units sold? | Margin and profitability analysis |
| Landed cost | What does it cost to bring the product to the target market? | Global sourcing and market comparison |
| Fully Allocated Cost | What cost must the project recover after relevant investments? | Pricing, break-even and investment decisions |
This is why the output should not be interpreted as one “correct” cost number. Each figure has a different decision boundary. A procurement manager may use production cost to compare factories, while a commercial decision-maker may need landed cost to compare sourcing markets and fully allocated cost to determine whether the planned selling price can recover the complete project investment. The value of the model is in keeping these questions separate while showing how they interact.
When supplier quotations become available, the most useful approach is to replace the relevant assumptions and observe which cost layer changes. If a supplier reduces the factory price but increases MOQ, tooling requirements, packaging cost, or lead time, the lower production cost may not translate into better project economics. Conversely, a higher unit quotation may be commercially acceptable if it reduces tooling exposure, improves production stability, or lowers downstream costs. This makes the calculator useful for supplier comparison and supply chain sourcing decisions, not just for producing an initial cost estimate.
How Pricing, Gross Margin, and Sales Volume Affect ROI
ROI is highly sensitive to the relationship between selling price, achievable gross margin, and the volume that can realistically be sold. These variables should not be adjusted independently because changing one can alter the commercial meaning of the others. A higher target retail price can increase revenue per unit, but only if the market can support that price after channel margins, platform fees, taxes, and other commercial deductions. A higher sales forecast can spread tooling and development investment across more units, but it also increases the amount of inventory and working capital that may need to be committed. The calculator therefore uses these inputs to test whether the expected return is supported by a commercially credible sales model rather than simply maximizing the calculated ROI.
The target gross margin is particularly useful as a control variable. If the expected manufacturing and landed costs require a selling price that is materially above the target market position, the problem is not necessarily that the margin target is too high. It may indicate that the product specification, sourcing model, packaging, logistics structure, or supplier economics need to change. Conversely, lowering the margin assumption can make a project appear more viable without improving its underlying competitiveness. A buyer should therefore use gross margin to expose the economic constraint, not to force the model into an acceptable result.
Sales volume creates a second-order effect because fixed investments behave differently at different production scales. Tooling, engineering, certification, and packaging setup costs may be relatively stable within a defined project scope, while production and logistics costs vary with volume. If the annual forecast increases from 5,000 to 20,000 units, the project may benefit from better amortization and purchasing efficiency. However, the higher forecast should only be used when production capacity, market demand, inventory turnover, and channel access can support it. Otherwise, the resulting ROI may reflect an assumption that is financially attractive but operationally unavailable.
A useful way to read the model is to test the three variables as scenarios rather than treating one calculated result as definitive:
| Scenario | Selling price | Sales volume | Likely effect on ROI | Main question |
|---|---|---|---|---|
| Conservative | Lower | Lower | ROI decreases | Can the project survive weaker demand? |
| Base case | Expected | Expected | Reference result | Are current assumptions commercially viable? |
| Upside case | Higher | Higher | ROI increases | Can the supply chain support the opportunity? |
| Cost-pressure case | Same | Same | ROI decreases | Which cost variable must be changed? |
This approach is more useful than relying on a single product pricing calculator output. If ROI remains acceptable under conservative assumptions, the project has greater financial resilience. If the project only works under the highest selling price and sales forecast, the result should be treated as a scenario requiring market and channel validation. The objective is not to produce the highest possible ROI. It is to identify the range of commercial conditions under which the project remains investable.
How the Calculator Measures Break-Even, Investment, and Payback
Break-even shows how much the project needs to sell before its relevant initial investment has been recovered. WIDQ’s model considers project-specific costs such as development, tooling, certification, and the initial production requirement when determining the investment hurdle. The resulting break-even volume provides a more practical reference than ROI alone because it converts the financial model into a sales requirement. If the calculated break-even volume is close to or above the realistic sales forecast, a high projected ROI may provide limited decision value because the business has little room for demand underperformance.
Total Initial Investment provides the other side of the equation. It represents the cash commitment required to move the project toward commercial operation, including applicable development costs, tooling, certification-related costs, and initial inventory or working capital requirements. This distinction matters for businesses that can achieve attractive margins but have limited available capital. A project may be profitable on a per-unit basis while still creating an unacceptable cash-flow burden if the first production commitment, tooling payment, and lead time require substantial funds before meaningful revenue is generated.
Payback Period connects these two dimensions by estimating how long it takes for the project to recover its initial investment under the modeled sales and profit assumptions. A short payback period can reduce capital exposure, but it should not automatically be interpreted as proof of low risk. The result depends on the sales forecast, selling price, cost assumptions, and timing of cash flows. Long supplier lead times, customer payment terms, inventory holding periods, or slower-than-expected sell-through can make the practical cash recovery period longer than the modeled result.
The relationship between these outputs can be used as a decision screen:
| Result | What it tells you | What to verify before commitment |
|---|---|---|
| Break-even volume | Required sales to recover modeled investment | Whether the market can support this volume |
| Total Initial Investment | Cash required to launch the project | Available working capital and payment schedule |
| Working Capital | Liquidity needed during production and inventory cycles | Supplier terms, lead time and inventory turnover |
| Payback Period | Estimated time to recover initial investment | Actual sales timing and cash conversion |
| ROI | Expected return relative to the modeled investment | Whether the assumptions remain realistic |
The important distinction is between financial attractiveness and financial resilience. A project with a very high ROI but a narrow margin for demand error may be less robust than a project with a lower ROI and a much more achievable break-even volume. When using WIDQ’s manufacturing financial analysis, decision-makers should therefore review ROI together with break-even, initial investment, working capital, and payback. If any one of these indicators changes materially after a supplier quotation, volume revision, or pricing update, the calculation should be rerun before resources are committed.
How to Interpret WIDQ’s Financial and Manufacturing Feasibility Report
The Final Report should be read as a decision record, not as a single profitability score. It connects product economics with sourcing, manufacturing, investment, and supply chain execution, so the result should be evaluated within the broader context of how a B2B product moves from sourcing and development to production and global distribution. For a broader view of these connected decisions, see our Global B2B Sourcing, Manufacturing & Supply Chain Guide. Start with the overall feasibility result, then work downward into the assumptions that produced it. Start with the overall feasibility result, then work downward into the assumptions that produced it. A strong ROI is only useful when the underlying selling price, sales forecast, manufacturing cost, investment requirement, and production conditions are commercially credible. For example, an attractive result can still require a first production commitment that exceeds available working capital, or depend on a sales volume that has not been validated. The report is most useful when it shows not only whether a project appears profitable, but also what conditions must remain true for that conclusion to hold.
The next step is to review the report in layers. First, check the commercial outputs such as actual gross margin, minimum viable retail price, net profit per unit, and annual net revenue. Then review the operating assumptions behind them, including MOQ, production capacity, production lead time, tooling lead time, packaging efficiency, and logistics cost. Finally, examine the capital requirements, including total fixed cost, working capital, and total initial investment. This sequence helps distinguish a margin problem from an execution problem or a financing problem.
This approach is also consistent with how large-scale manufacturing decisions are evaluated in practice. McKinsey documented a case involving a global consumer-packaged-goods manufacturer that evaluated more than 15,000 SKUs under different production-planning scenarios. By comparing manufacturing costs and lead times across alternative configurations, the analysis identified potential manufacturing-cost savings of more than 6 percent and lead-time reductions of almost 10 percent. The important point is not the specific percentage, but the decision method: the economically better option was identified by comparing the full operating scenario rather than relying on one manufacturing-cost variable.
| Decision Layer | Key Metrics in the WIDQ Report | What the Metric Reveals | Risk Signal to Validate | Recommended B2B Decision |
|---|---|---|---|---|
| Commercial economics | Actual Gross Margin, Minimum Viable Retail Price, Net Profit per Unit, Annual Net Revenue | Whether the target selling price and expected sales volume can support the intended commercial model | Profitability depends on an aggressive selling price or an unvalidated sales forecast | Validate market price, channel economics, and demand before committing production volume |
| Manufacturing cost | Total Production Cost per Unit, Material Cost, Packaging Cost, Quality & Risk Cost | The recurring cost required to produce and prepare each unit | A low factory price is offset by packaging, quality, logistics, or other downstream costs | Compare suppliers using total cost rather than quoted unit price alone |
| Landed economics | Freight Cost per Unit, Total Logistics & Landed Cost per Unit | The cost of moving finished goods from production to the target market | Freight, duties, handling, or sourcing location materially changes the economics | Recalculate using the actual destination, Incoterm, freight mode, and trade requirements |
| Tooling and development | Tooling Cost, Development Cost, Certification Cost, Tooling Lead Time | The upfront investment and time required before commercial production | High fixed investment creates downside exposure before meaningful revenue is generated | Obtain supplier quotations and validate tooling, certification, and development requirements |
| Production feasibility | MOQ, Daily Production Capacity, Production Cycle Time, First Batch Lead Time | Whether the expected sales plan can be translated into executable production | Forecasted demand exceeds realistic capacity, or MOQ creates excessive inventory exposure | Align order quantity, capacity, and production schedule before issuing a purchase commitment |
| Working capital | Working Capital Requirement, Total Initial Investment | The cash required to finance inventory, production, and project launch | The project is profitable on paper but requires more liquidity than the business can comfortably fund | Test cash requirements against payment terms, inventory turnover, and expected sales timing |
| Capital recovery | Break-Even Volume, Payback Period, Total Fixed Cost | How quickly the initial investment can be recovered through commercial sales | Break-even depends on sales volumes that have not been validated | Treat the project as conditional until demand and sales assumptions are supported by evidence |
| Fully allocated economics | Fully Allocated Cost per Unit | The economic cost after manufacturing, development, tooling, and packaging are allocated across expected production | A project appears attractive based on factory cost but loses margin after project-specific investment is included | Use fully allocated cost when comparing product concepts, suppliers, and launch scenarios |
| Decision sensitivity | Changes in volume, price, cost, lead time, and sourcing assumptions | Which assumptions have the greatest influence on ROI and cash exposure | A small change in one high-impact variable materially changes the investment conclusion | Recalculate the model before changing specifications, supplier, production volume, or commercial assumptions |
The report should also be used to identify the assumptions that deserve external validation. If tooling cost represents a large portion of initial investment, obtain a supplier quotation before treating the result as firm. If the model depends heavily on annual sales volume, validate the forecast through actual customer demand, channel data, or relevant market research. If logistics or certification materially affects landed cost, confirm the applicable route and requirements before production. This turns the Final Report into a prioritization tool: the most financially sensitive assumptions should be validated first.
A useful rule is to ask three questions before moving forward: Which result is driving the investment case? Which assumption could invalidate that result? What evidence is available to confirm that assumption? If the answer to the second or third question is unclear, the report should be treated as a working scenario rather than a production commitment. The objective of the calculator is not to remove uncertainty from a B2B manufacturing project. It is to make that uncertainty visible enough to manage.

When to Recalculate ROI Before Committing to Production
Recalculation is necessary whenever a change affects a variable that materially influences unit economics, total investment, cash requirements, or expected revenue. This can happen several times between initial product definition and mass production. A supplier may revise the quotation after tooling specifications are confirmed, an engineering change may increase material consumption, or a certification requirement may add development time and cost. Treating the original calculation as fixed after these changes creates a false sense of precision.
Supplier quotation changes are one of the clearest triggers. Do not update only the unit manufacturing price if the new quotation also changes MOQ, tooling, payment terms, production capacity, packaging, or lead time. A lower unit price can require a larger initial purchase, while a higher MOQ can increase inventory exposure. Similarly, a longer production lead time can increase working capital requirements even when the quoted factory price remains unchanged. The correct comparison is therefore between the complete commercial scenarios, not between two unit prices.
Market assumptions should also trigger a new calculation. If the expected retail price falls, the sales forecast changes, or the target channel requires different margins or fees, the original ROI may no longer represent the current opportunity. The same applies when the product specification changes. A heavier product can increase material and freight costs; a design change can require a different mold; additional features can affect certification, assembly time, packaging, and QC requirements. These changes can propagate through several parts of the model simultaneously.
A practical recalculation trigger can be organized as follows:
| Change | Recalculate? | Why |
|---|---|---|
| Supplier unit price changes | Yes | Direct effect on recurring cost |
| MOQ changes materially | Yes | Changes inventory and working capital exposure |
| Tooling specification changes | Yes | Changes upfront investment and amortization |
| Product dimensions or weight change | Yes | May affect materials, packaging and freight |
| Sales forecast changes | Yes | Changes volume economics and investment recovery |
| Target selling price changes | Yes | Directly affects revenue and margin |
| Certification requirements change | Yes | Can add development and compliance costs |
| Freight route or Incoterm changes | Yes | Can materially change landed cost |
| Minor administrative changes | Usually no | May not affect the economic model |
The timing of recalculation matters as much as the trigger. Recalculate before signing a tooling agreement, placing a significant first production order, changing suppliers, approving a major engineering change, or committing additional working capital. At these points, the cost of acting on an outdated model can become irreversible. A small change in an early-stage estimate is usually inexpensive to correct; discovering after tooling or inventory has been funded that the project no longer meets its required economics is substantially harder to reverse.
For recurring procurement or product development programs, the calculation can become a version-controlled decision record. Keep the assumptions associated with each major quotation, specification, volume forecast, or sourcing scenario and compare the resulting break-even, investment, and ROI changes. This creates a repeatable process for deciding whether to proceed, renegotiate, redesign, change sourcing conditions, or pause the project. In that context, a manufacturing ROI calculator is not simply a pre-production calculator. It becomes a checkpoint that should be revisited whenever the conditions supporting the original investment decision materially change.
FAQ
Should ROI be calculated from the supplier quotation or from the complete project cost?
Use the complete project cost when deciding whether an investment is commercially viable. A supplier quotation is only one input and may cover manufacturing under specific MOQ, material, packaging, or payment assumptions. The decision model should also account for relevant tooling, engineering, certification, packaging, quality, logistics, working capital, and other project-specific costs. The common mistake is to calculate margin from the factory price and treat the remaining expenses as secondary. That can make a project appear profitable while the actual capital recovery is weak. Use the supplier quotation as a validated cost input, then assess how the complete cost structure affects break-even and payback before approving production.
How should a business handle an ROI result when the sales forecast is uncertain?
Do not treat the forecast as a confirmed outcome. Test several realistic volume scenarios and determine how much the ROI depends on achieving the highest forecast. A project that remains viable at lower volumes has greater commercial tolerance than one that becomes attractive only at an optimistic sales level. This is particularly important when tooling, certification, or development costs are significant because these expenses must be recovered regardless of whether the forecast is achieved. Early purchase orders, distributor commitments, channel data, validated customer demand, or comparable market evidence can strengthen the forecast. If the forecast remains speculative, the calculator should be used to identify the minimum viable sales volume rather than justify the maximum expected opportunity.
When does a lower manufacturing cost actually improve the investment case?
A lower unit cost improves the investment case only when the reduction does not introduce a larger cost or execution risk elsewhere. A supplier may lower price through higher MOQ, different materials, reduced inspection, longer payment commitments, or a production process that does not meet the required specification. The correct comparison is therefore based on equivalent technical and commercial conditions. Compare the resulting landed cost, quality exposure, working capital, lead time, and expected selling economics rather than comparing factory quotations alone. If a cost reduction also reduces quality or increases RMA, inventory, or compliance risk, the nominal saving may not represent a real improvement in project profitability.
How should tooling investment be evaluated against expected production volume?
Tooling should be evaluated as a capital commitment with a recovery period, not simply as a one-time manufacturing expense. Compare the tooling investment with expected lifetime volume, production requirements, mold life, lead time, and the cost of alternative tooling configurations. A higher initial tooling investment can be justified if it materially improves capacity or reduces unit cost across a sufficiently large volume. However, committing to expensive tooling before demand is validated increases downside exposure. The key question is not whether the most efficient mold configuration exists, but whether the expected demand and product lifecycle justify paying for that capacity now. When demand is uncertain, staged investment may provide better risk control.
What is the difference between production cost, COGS, and fully allocated cost when evaluating ROI?
These measures should not be treated as interchangeable. Production cost describes the cost of manufacturing the unit, while COGS is used to connect the cost of goods sold with revenue and gross profit. Fully allocated cost can extend further by allocating relevant development, tooling, packaging, and other project-specific investments across expected production. Each measure answers a different question. Using only production cost may be appropriate for evaluating factory efficiency, but it can understate the investment required to launch a new product. For ROI decisions, the broader cost structure is generally more useful because the business must recover both recurring costs and relevant upfront commitments.
When should a company recalculate ROI after receiving a new supplier quotation?
Recalculate whenever the quotation changes a material assumption in the original model. This includes unit price, MOQ, tooling, payment terms, packaging, production lead time, material specification, inspection requirements, or Incoterms. A new supplier may offer a lower manufacturing price while increasing MOQ or working-capital requirements. Likewise, a different production location can change freight, duties, lead time, and inventory exposure. When comparing global sourcing solutions, evaluate the complete cost and execution scenario rather than the factory quotation alone. Recalculate the complete scenario and compare the resulting break-even volume, initial investment, payback, and ROI. This prevents supplier selection from becoming a price-only decision.
Can a high ROI result be considered sufficient evidence to start production?
No. A high calculated ROI indicates that the defined assumptions produce an attractive financial result, but it does not validate those assumptions. Before production, critical inputs should be checked against supplier quotations, technical specifications, market evidence, compliance requirements, production capacity, and logistics conditions. A particularly high ROI can even justify additional scrutiny when it depends on an unusually low cost or unusually high selling price. The practical test is whether the project remains viable after replacing estimates with validated information and testing reasonable downside scenarios. If a small change in volume, price, or cost eliminates the expected return, the project needs further validation before an irreversible commitment.
What should be changed when the calculated ROI is below the required investment threshold?
Do not immediately reject the product or simply increase the target selling price. First identify which variable has the greatest influence on the result and whether it can realistically be changed. The available responses may include redesigning the product, changing materials, adjusting tooling, negotiating supplier terms, increasing production efficiency, revising packaging, changing the sourcing route, or reassessing the commercial price and volume. Each change should be tested against its secondary effects. For example, reducing material cost may affect quality, while increasing MOQ may reduce unit cost but increase inventory exposure. The objective is to find a commercially executable configuration rather than force the calculation to produce an acceptable ROI.
Conclusion
A manufacturing investment decision should not depend on a single supplier price or an attractive ROI percentage. The stronger approach is to connect technical requirements, production economics, market assumptions, capital exposure, and execution constraints into one decision model. WIDQ’s calculator provides a structured way to test these relationships, but the quality of the result remains dependent on the quality of the assumptions entered into it. The most useful output is therefore not simply a projected return, but a clear view of what must remain true for that return to be achieved, including validated demand, realistic pricing, production capacity, and relevant global market insights.
Before committing to tooling, production, or a larger procurement volume, use the calculated results as a decision checkpoint. Validate the assumptions with suppliers, market evidence, logistics conditions, and actual commercial data, then recalculate when material conditions change. A robust project is one that remains commercially viable under realistic changes in cost, price, volume, and timing – not one that produces the highest result under a single optimistic scenario.