Not Sure About Your Unit Cost or Manufacturing Overhead?
Product investment decisions rarely fail because a business cannot estimate demand. More often, they fail because decision-makers commit resources before understanding the financial conditions required to recover those investments. Break even analysis, combined with manufacturing cost analysis, product profitability analysis, and a realistic view of fixed and variable costs, provides a structured way to evaluate whether a project can generate sustainable returns rather than temporary sales. For procurement teams, distributors, OEM buyers, and trading companies, the question is not whether a product can be manufactured, but whether the expected sales volume, pricing strategy, and total cost structure justify the investment before production begins.
In today’s B2B environment, investment decisions extend far beyond unit price comparisons. Tooling costs, compliance requirements, logistics, inventory carrying costs, supplier capabilities, and pricing pressure all influence the break even point and long-term profitability. Businesses that rely solely on a break even calculator or historical benchmarks often underestimate hidden costs and overestimate market capacity. A disciplined financial evaluation framework allows organizations to compare sourcing strategies, validate product assumptions, and reduce irreversible capital commitments before purchase orders are issued or manufacturing resources are allocated.

Why Break-Even Analysis Is a Critical Decision Tool Before Product Investment
Many organizations still evaluate product opportunities by comparing supplier quotations or projected gross margins. While these metrics remain useful, they answer only part of the investment question. Gross margin measures profitability after a sale, whereas break even analysis determines the minimum business conditions required to recover every committed investment. This distinction becomes particularly important when projects involve tooling, engineering, certification, packaging development, or long production lead times. A product with an attractive gross margin may still expose the business to unacceptable financial risk if its break-even threshold cannot realistically be achieved within the expected market lifecycle.
The primary value of break-even analysis lies in shifting discussions from optimistic revenue projections to measurable financial assumptions. Instead of asking, “Can this product sell?” decision-makers ask, “How many units must be sold before this investment becomes financially sustainable?” This perspective transforms product evaluation from a sales forecast into a structured investment assessment. When integrated with cost volume profit analysis, organizations can model how pricing, production volume, contribution margin, and operating costs interact under different commercial scenarios instead of relying on a single forecast.
The table below illustrates why two products with similar selling prices may represent very different investment decisions.
| Evaluation Factor | Product A | Product B | Decision Impact |
|---|---|---|---|
| Initial Tooling Investment | Low | High | Higher upfront capital increases financial exposure. |
| Unit Manufacturing Cost | Higher | Lower | Lower unit cost benefits long-term production volume. |
| Expected Sales Volume | Moderate | Moderate | Similar demand does not guarantee similar investment risk. |
| Break-Even Point | Lower | Higher | Faster capital recovery generally reduces project risk. |
| Investment Decision | Lower Risk | Higher Risk | Total investment should outweigh unit cost advantages. |
This comparison demonstrates why procurement teams should evaluate the entire investment structure instead of selecting suppliers based solely on quotation prices. A lower manufacturing cost may appear attractive, but if achieving that cost requires significant tooling investment or higher minimum order quantities, the actual business risk may increase rather than decrease.
Another reason break-even analysis has become a strategic decision tool is that it establishes a common financial language across procurement, engineering, finance, and commercial teams. Procurement focuses on supplier capability and cost, engineering evaluates manufacturability, finance monitors capital allocation, and sales estimates market demand. Without a shared financial framework, each department may optimize its own objectives while overlooking the overall investment outcome. The break even analysis formula provides a consistent reference point that aligns these functions around one measurable objective – determining whether the planned investment can realistically recover its costs under expected operating conditions.
Break-even analysis should not be viewed as a standalone calculation or a replacement for broader financial planning. It performs best when combined with manufacturing cost analysis, product pricing evaluation, total cost assessment, and ROI forecasting. As projects become more complex, spreadsheets and simplified calculators often struggle to incorporate tooling amortization, compliance costs, logistics, inventory carrying costs, and multiple sourcing scenarios. In these situations, a comprehensive Manufacturing Cost & ROI Calculator can help decision-makers evaluate the complete investment model, including COGS, break-even point, cash flow, and profitability assumptions before committing resources to production. This integrated approach improves investment transparency and reduces the likelihood of costly decisions that are difficult to reverse.
What Determines the Break-Even Point in B2B Product Investments
The break-even point is determined by the interaction of multiple business variables rather than a single financial formula. While the traditional calculation focuses on fixed costs, variable costs, and contribution margin, real-world B2B investments involve additional factors that influence how quickly capital can be recovered. Tooling expenditure, engineering changes, compliance testing, production yield, procurement strategy, inventory carrying costs, and customer payment terms all affect the financial threshold at which a project becomes commercially sustainable. Ignoring any of these variables may not significantly change the accounting result, but it can materially alter the investment decision. For businesses evaluating new products, supplier relationships, or manufacturing opportunities, break-even analysis should be viewed as one part of a broader global B2B sourcing, manufacturing, and supply chain strategy rather than an isolated financial calculation.
A practical way to evaluate these variables is to separate costs according to how they behave throughout the project lifecycle instead of simply classifying them as “manufacturing” or “operating” expenses. This approach helps decision-makers understand which costs remain stable regardless of production volume and which increase with every additional unit produced.
| Cost Category | Typical Examples | Primary Impact on Investment |
|---|---|---|
| Fixed Costs | Tooling, product development, engineering, certifications | Increase initial capital commitment and delay cost recovery |
| Variable Costs | Materials, direct labor, packaging, inspection | Determine contribution margin and scalability |
| Semi-Variable Costs | Warehousing, equipment maintenance, quality assurance | Increase gradually as production expands |
| Market-Driven Costs | Freight, tariffs, exchange rates, platform commissions | Affect profitability after sourcing decisions are made |
This classification also explains why two products with identical manufacturing costs can produce completely different financial outcomes. An OEM product requiring custom tooling, multiple certifications, and extensive validation may generate a competitive unit cost after volume increases, yet its higher upfront investment substantially raises the commercial threshold. Conversely, an existing product sourced through established supply chains may have a higher purchase price but require little capital before sales begin. From an investment perspective, the second option may deliver lower financial risk despite appearing less competitive on a quotation sheet.
Another variable frequently underestimated is production scale. Economies of scale reduce average manufacturing cost over time, but they also require larger purchasing commitments, higher inventory exposure, and greater working capital. This creates a strategic trade-off. Businesses seeking the lowest possible unit cost often accept larger minimum order quantities, while organizations prioritizing financial flexibility may deliberately choose suppliers with smaller production batches, even at a higher cost per unit. The optimal decision depends on market certainty, inventory turnover, and cash flow capacity rather than manufacturing efficiency alone.
Rather than evaluating these variables independently, experienced procurement teams model several commercial scenarios before approving investment. A base-case forecast is compared against conservative and optimistic assumptions to determine how changes in demand, selling price, logistics, or procurement costs influence financial performance. Combining manufacturing cost analysis with scenario planning enables businesses to identify which assumptions have the greatest influence on profitability and where additional supplier negotiations or product redesign can meaningfully reduce investment risk.
How to Apply Break-Even Analysis Before Selecting Suppliers or Launching Products
Supplier evaluation should begin with total investment requirements rather than purchase price. During competitive sourcing, quotations often emphasize unit cost because it provides an immediate basis for comparison. However, procurement decisions rarely fail because one supplier charges slightly more per unit. They fail because the complete financial commitment—including tooling, engineering support, quality systems, lead times, and inventory requirements—is not evaluated before contracts are signed. For companies working through a B2B sourcing platform, supplier selection should also consider manufacturing capability, cost transparency, and long-term supply reliability rather than focusing only on initial quotations. Break-even analysis provides a framework for comparing suppliers based on capital efficiency instead of pricing alone.
A structured supplier evaluation process can reduce this bias by examining every quotation from the perspective of investment recovery.
| Evaluation Stage | Primary Question | Decision Objective |
|---|---|---|
| Supplier Capability | Can the supplier consistently meet technical and quality requirements? | Reduce execution risk |
| Cost Structure | Which costs are fixed and which vary with production volume? | Improve financial transparency |
| Production Conditions | How do MOQ, lead time, and capacity influence capital requirements? | Balance cost and flexibility |
| Commercial Feasibility | Under realistic demand assumptions, which option reaches profitability sooner? | Support investment approval |
This framework is particularly valuable when comparing multiple sourcing strategies. For example, one supplier may offer lower manufacturing costs but require high-volume production and dedicated tooling. Another supplier may quote a higher unit price while supporting smaller production runs and shorter lead times. Neither option is universally better. Organizations entering new markets, testing unfamiliar product categories, or validating customer demand often benefit from preserving capital flexibility rather than minimizing unit cost. Established businesses with predictable order volumes may reach a different conclusion because their financial priorities emphasize long-term operational efficiency.
The same principle applies before launching new products. Product approval should not rely exclusively on projected revenue or expected margin. Instead, decision-makers should validate whether the underlying assumptions remain financially acceptable if market conditions deviate from plan. Practical sensitivity testing typically includes changes in annual sales volume, supplier pricing, logistics costs, customer acquisition costs, and payment cycles. This process transforms financial projections from static forecasts into decision-support models capable of accommodating uncertainty.
As projects become more complex, manually maintaining these scenarios becomes increasingly difficult. A professional Manufacturing Cost & ROI Calculator can consolidate project definition, cost structure, production assumptions, financial modeling, and investment analysis into a single workflow. Instead of relying on isolated spreadsheets or a basic product pricing calculator, procurement teams can evaluate manufacturing cost, COGS, break-even point, cash flow, and ROI within one decision model before issuing purchase orders or approving production. For organizations managing multiple suppliers or evaluating global sourcing solutions, this integrated approach improves consistency across investment reviews while reducing the risk of decisions based on incomplete financial information.
Common Break-Even Analysis Mistakes That Increase Business Risk
One of the most common errors is treating break-even analysis as a static calculation instead of a decision framework that evolves throughout the product lifecycle. Many businesses calculate the financial threshold during project approval and never revisit the assumptions after supplier negotiations, engineering revisions, or market changes. In practice, every major adjustment—including material substitution, design optimization, tariff changes, or revised customer demand—changes the underlying cost structure. Continuing to make procurement or production decisions using outdated assumptions gradually increases financial exposure without making the risk immediately visible.
Another frequent mistake is evaluating manufacturing costs while excluding costs that originate outside the factory. Direct production expenses are relatively easy to estimate, but inventory carrying costs, warranty reserves, quality failures, compliance updates, and working capital requirements often emerge only after production begins. These costs rarely affect the first purchase order, yet they directly influence long-term capital recovery and operating performance. Businesses that separate procurement decisions from downstream operational costs often underestimate the total investment required to sustain a product over its commercial lifecycle.
The table below summarizes several recurring decision errors and their potential business consequences.
| Common Mistake | Immediate Effect | Long-Term Business Impact |
|---|---|---|
| Using outdated cost assumptions | Financial projections remain inaccurate | Investment decisions become progressively less reliable |
| Ignoring post-production costs | Initial profitability appears stronger | Cash flow pressure increases after product launch |
| Assuming forecasted sales will be achieved | Break-even target appears achievable | Capital recovery takes significantly longer than expected |
| Comparing suppliers only by unit price | Lower quotation appears more attractive | Hidden investment requirements increase total project cost |
| Treating all products equally | Evaluation process lacks prioritization | Capital is allocated to lower-value opportunities |
A less visible but equally important mistake is applying identical financial assumptions across different product strategies. A standardized product purchased from an established supplier typically follows a different investment profile than a customized OEM project or a product entering a new market. Development timelines, engineering uncertainty, regulatory requirements, and supplier collaboration all influence commercial risk differently. Reusing the same financial model across these situations creates false consistency while masking project-specific uncertainties that require independent evaluation.
Organizations can reduce these risks by introducing structured review points throughout the investment process rather than relying on a single approval stage. Updating financial assumptions after prototype validation, supplier selection, pilot production, and initial market feedback creates a more resilient decision process. Instead of asking whether the original analysis was correct, decision-makers continuously verify whether current assumptions still justify additional investment as the project progresses.
Why a Break-Even Calculator Alone Cannot Support Complex B2B Decisions
A traditional break even calculator performs one specific task well: estimating the sales volume required to recover predefined costs. However, product investment decisions rarely depend on that calculation alone. Modern B2B procurement requires organizations to evaluate multiple variables that change simultaneously, including supplier capability, engineering complexity, logistics, compliance obligations, payment terms, inventory strategy, and market uncertainty. A single mathematical output cannot adequately represent the interactions among these factors, particularly when decisions involve long production cycles or substantial capital commitments.
The limitation becomes more apparent when comparing projects with different business models. A distributor sourcing an existing product from multiple qualified suppliers faces a different financial structure than a manufacturer developing an OEM product from concept. Although both projects can calculate a numerical break-even threshold, the underlying decision drivers are fundamentally different. One prioritizes purchasing flexibility and inventory turnover, while the other must also evaluate development investment, tooling depreciation, engineering resources, and technical validation. Applying the same simplified calculation to both projects risks overlooking variables that materially influence financial performance.
The following comparison illustrates the difference between a basic calculation tool and a comprehensive investment evaluation process.
| Basic Calculator Focus | Comprehensive Investment Evaluation |
|---|---|
| Fixed costs and unit contribution | Complete cost structure across the product lifecycle |
| Single break-even output | Multiple financial scenarios and sensitivity analysis |
| Static assumptions | Dynamic updates based on supplier and market changes |
| Isolated financial calculation | Integration with procurement, engineering, logistics, and finance |
| Sales volume target | Overall investment feasibility and capital efficiency |
Another practical limitation is that simplified tools generally assume stable operating conditions. In reality, supplier quotations change, freight rates fluctuate, customer demand shifts, and regulatory requirements evolve throughout a project’s lifecycle. Financial models that cannot accommodate these variables often encourage excessive confidence in a single projection. More reliable decision-making comes from testing several realistic scenarios and understanding which assumptions have the greatest influence on investment outcomes rather than relying on one forecast as the expected result.
For this reason, many procurement and finance teams have moved beyond standalone calculators toward integrated decision models. A comprehensive Manufacturing Cost & ROI Calculator supports the entire evaluation process by connecting project definition, manufacturing cost analysis, COGS estimation, tooling investment, production planning, logistics assumptions, break-even modeling, and ROI assessment within a unified workflow. Rather than replacing financial judgment, such a model improves decision quality by ensuring that critical variables are evaluated together before procurement commitments or production investments become difficult to reverse.
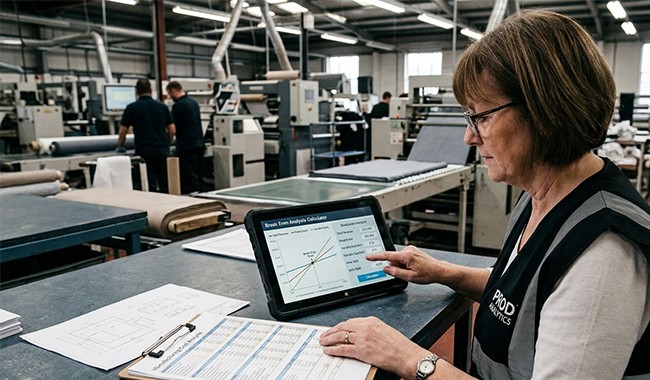
Case Study: How Manufacturing Cost and ROI Analysis Prevented a High-Risk Product Launch Decision
Launching a new product is rarely a simple question of whether the estimated selling price is higher than the manufacturing cost. In B2B environments, the critical decision is whether the entire investment structure can support a predictable return under realistic market conditions. Many product failures do not originate from poor product ideas or unreliable suppliers. They happen because businesses commit to tooling, inventory, certification, and production capacity before understanding the full financial exposure.
Consider a distributor evaluating the launch of a customized electronic accessory under an OEM manufacturing model. The product category showed strong market demand, comparable products were selling between $39 and $59, and several suppliers provided competitive quotations. Based on the initial supplier proposal, the project appeared financially attractive.
However, the procurement team initially evaluated the opportunity mainly through unit economics:
| Initial Product Evaluation | Assumption |
|---|---|
| Target Retail Price | $49 |
| Estimated Factory Price (EXW) | $12 |
| Initial Order Quantity | 10,000 units |
| Expected Gross Margin | Acceptable based on unit cost |
The initial calculation suggested that the product had sufficient margin potential. However, the decision framework did not include several investment variables that would directly affect capital recovery.
Before mass production, the company needed to commit resources across multiple cost areas:
| Investment Category | Estimated Impact | Decision Risk |
|---|---|---|
| Product Engineering | $18,000 | Required for design optimization and production feasibility |
| Tooling & Manufacturing Fixtures | $45,000 | Difficult to recover if market demand underperforms |
| Certification & Compliance Testing | $12,000 | Required before entering target markets |
| Custom Packaging Development | $8,000 | Additional investment for brand positioning |
| Initial Inventory Commitment | $120,000 | Capital locked before demand validation |
| Quality Control & Inspection | $6,000 | Required to reduce return and warranty risks |
| Logistics & Import Costs | Variable | Direct impact on landed cost |
After incorporating these factors, the project evaluation changed significantly. The primary question was no longer:
“Can the company manufacture this product at an acceptable unit cost?”
The more important question became:
“Can the expected sales volume recover the complete investment before market conditions change?”
The revised financial model showed that the project required a substantially higher sales volume to recover fixed investment. If monthly demand reached the forecast level, the product could generate acceptable returns. However, if actual demand reached only 60-70% of the forecast, the company would face a longer capital recovery period and increased inventory exposure.
| Investment Scenario | Demand Achievement | Annual Sales Volume | Revenue Impact | Break-Even Status | Capital Risk Assessment | Recommended Decision |
|---|---|---|---|---|---|---|
| Optimistic Case | 100% of forecast demand | 50,000 units | Full revenue target achieved | Fixed investment recovered within planned lifecycle | Lower inventory pressure and stronger cash flow recovery | Proceed with planned production scale |
| Base Case | 70% of forecast demand | 35,000 units | Revenue below original forecast | Break-even period extends and ROI decreases | Higher working capital pressure and slower investment recovery | Optimize cost structure before scaling |
| Downside Case | 40% of forecast demand | 20,000 units | Significant revenue gap | Break-even point may not be reached within product lifecycle | High inventory exposure and reduced capital efficiency | Delay investment or reduce customization |
In practice, demand uncertainty remains one of the largest variables affecting product investment decisions. Research from McKinsey Company has highlighted that supply chain and operational planning increasingly require scenario-based decision models rather than relying on single-point forecasts.
This analysis changed the supplier and product strategy. Instead of immediately moving into full OEM production, the company adjusted the project approach by reducing initial customization, negotiating a lower-risk production structure, and validating demand before increasing investment.
The lesson is not that OEM product development is unsuitable for new opportunities. OEM manufacturing can create stronger differentiation and long-term competitive advantages when the investment structure matches realistic demand expectations. The critical factor is whether decision-makers understand the relationship between fixed investment, variable costs, production volume, pricing strategy, and market uncertainty before committing capital.
A structured Manufacturing Cost & ROI analysis provides this visibility by connecting operational assumptions with financial outcomes. It allows procurement teams, distributors, and brand owners to determine whether a product should move forward, require optimization, or be reconsidered before irreversible costs are created.
Before committing to tooling, inventory, or production capacity, businesses can use WIDQ’s Manufacturing Cost & ROI Calculator to evaluate product feasibility, cost structure, break-even requirements, and expected return scenarios.
Use a Manufacturing Cost and ROI Calculator to Evaluate Complete Product Investment
A complete product investment evaluation requires more than calculating whether projected sales can cover initial costs. Decision-makers need visibility into how resources move through the entire product lifecycle – from concept validation and supplier selection to production, market entry, and profitability recovery. A Manufacturing Cost and ROI Calculator provides a structured environment where different cost factors can be evaluated together, allowing businesses to understand not only when an investment reaches the break-even point, but also whether the overall project remains commercially attractive under realistic operating conditions.
The main advantage of an integrated calculation model is the ability to connect operational assumptions with financial outcomes. Instead of reviewing separate files for supplier quotations, tooling estimates, logistics costs, and sales forecasts, procurement and commercial teams can evaluate the relationship between these variables within one framework. This is particularly important for OEM projects, customized products, and new category expansion where early assumptions often change as technical requirements become clearer.
A practical investment evaluation workflow should consider multiple stages rather than a single financial calculation.
| Evaluation Stage | Key Inputs | Decision Purpose |
|---|---|---|
| Project Definition | Product objective, development stage, production strategy | Determine whether the project requires new development, customization, or existing supply capability |
| Product Specification | Dimensions, materials, technical requirements, lifecycle expectations | Estimate manufacturing complexity and cost drivers |
| Production Planning | Tooling, MOQ, production volume, quality requirements | Evaluate scalability and operational feasibility |
| Financial Modeling | Pricing, COGS, margin targets, investment recovery | Measure profitability potential and capital efficiency |
| Final Assessment | Risk factors, sensitivity scenarios, ROI expectations | Support approval or adjustment decisions before production |
For businesses using a B2B sourcing platform or evaluating multiple sourcing strategies, this type of model improves consistency between commercial goals and supply chain execution. A sourcing team may identify a promising product opportunity through market research or product guides, but the final decision depends on whether the product can achieve acceptable financial performance after considering manufacturing, logistics, compliance, and operational costs. The purpose of the calculator is not to guarantee success, but to expose the assumptions that determine success or failure before significant resources are committed.
A professional calculator should also support scenario analysis rather than only producing a single break-even result. For example, decision-makers need to understand how profitability changes when production volume decreases, supplier costs increase, shipping conditions change, or target pricing requires adjustment. WIDQ’s Manufacturing Cost & ROI Calculator is designed around this broader evaluation approach by combining product specifications, manufacturing assumptions, tooling investment, COGS estimation, cost structure analysis, break-even modeling, and ROI forecasting into one integrated workflow. This allows procurement teams, brand owners, and commercial decision-makers to evaluate product feasibility before committing to production resources.
For this reason, tools such as the Manufacturing Cost & ROI Calculator should be viewed as part of a broader investment process rather than a simple replacement for spreadsheets. By connecting manufacturing cost analysis, investment planning, profitability assessment, and ROI evaluation, solutions like WIDQ’s calculator help businesses create a more reliable decision framework before moving from product evaluation into manufacturing execution. The objective is not to predict the future with certainty, but to improve decision quality by making cost assumptions, financial risks, and operational requirements visible before they become irreversible commitments.
Best Practices for Building Repeatable Product Investment Decisions
Successful businesses rarely evaluate each product opportunity from the beginning every time. As product portfolios expand and sourcing activities become more complex, they develop repeatable evaluation systems that allow teams to compare opportunities using consistent criteria. When evaluating a new sourcing product, decision-makers need a structured process to assess market potential, supplier capability, cost assumptions, and expected financial outcomes before allocating resources. This does not mean applying identical assumptions to every project. Instead, it means creating a structured process where different product categories, suppliers, and market conditions can be assessed through comparable decision factors.
The first step is establishing clear investment criteria before supplier discussions begin. Without predefined evaluation standards, teams often become influenced by individual supplier advantages, market excitement, or short-term pricing opportunities. A structured framework helps separate attractive opportunities from commercially viable investments.
A practical product investment review process may include the following stages:
1. Define the business objective
- Clarify whether the goal is entering a new category, expanding an existing product line, improving margins, or developing an OEM product.
2.Validate cost assumptions
- Confirm manufacturing costs, tooling requirements, logistics expenses, compliance requirements, and inventory commitments.
3.Model multiple scenarios
- Evaluate conservative, expected, and optimistic conditions instead of relying on one sales forecast.
4.Review operational feasibility
- Assess supplier capability, production capacity, quality control requirements, and fulfillment risks.
5.Measure investment performance
- Compare expected profitability, capital recovery period, and long-term scalability.
This approach allows organizations to make decisions based on comparable evidence rather than individual opinions. For example, when selecting top products for expansion, a retailer or distributor can evaluate each opportunity through the same financial and operational framework. A product with strong demand but weak cost structure may require redesign or a different sourcing strategy, while a less visible product with stronger margins and lower operational complexity may represent a better long-term opportunity.
Another important practice is separating early validation from large-scale commitment. Many investment mistakes occur because businesses move directly from product interest to high-volume purchasing without confirming market acceptance, supplier reliability, or cost assumptions. Smaller validation stages, pilot orders, prototype reviews, and initial customer feedback can reduce uncertainty before larger capital allocation decisions are made.
| Decision Stage | Main Objective | Avoided Risk |
|---|---|---|
| Initial Evaluation | Confirm commercial potential | Investing in unsuitable products |
| Supplier Validation | Verify production capability | Selecting suppliers unable to support requirements |
| Pilot Production | Test cost and quality assumptions | Scaling problems after large commitments |
| Market Expansion | Confirm sustainable demand | Excess inventory and capital pressure |
Finally, repeatable investment decisions require continuous improvement. Historical project data should be used to refine future evaluations, including actual production costs, supplier performance, quality issues, lead times, and market response. Over time, this creates a stronger internal decision system where procurement teams can identify patterns, improve sourcing strategies, and allocate resources toward opportunities with more predictable outcomes.
A mature investment process does not eliminate uncertainty. Instead, it ensures uncertainty is identified, measured, and managed before it becomes an irreversible business cost. By combining structured financial evaluation with operational experience, businesses can make product decisions that support sustainable growth rather than short-term opportunities.
FAQ
How can businesses know whether a product opportunity is worth investing in before production?
A product opportunity should not be approved based only on expected demand, supplier pricing, or market interest. A stronger decision requires evaluating whether the expected sales volume can realistically support the total investment required. This includes manufacturing costs, tooling, development expenses, logistics, compliance, inventory requirements, and operational resources. The key question is not whether a product can generate revenue, but whether the business can recover its investment within an acceptable timeframe. Companies should compare multiple scenarios, including conservative demand assumptions, before committing to production resources.
Why is the lowest supplier quotation not always the best sourcing decision?
The lowest unit price may reduce immediate purchasing costs but does not always create the best financial outcome. A supplier with a lower quotation may require higher MOQ, longer lead times, additional tooling investment, or increased quality control costs. A better approach is to compare suppliers based on total investment impact, including production scalability, reliability, and cost recovery potential. Businesses evaluating an OEM product or customized solution should focus on long-term cost efficiency rather than selecting the cheapest initial offer.
What costs are commonly missed when evaluating product profitability?
Many businesses underestimate costs that occur outside direct manufacturing. Commonly overlooked factors include tooling amortization, engineering changes, certification expenses, packaging development, inspection costs, freight fluctuations, import duties, inventory holding, and warranty-related expenses. These costs may not appear in the first supplier quotation but can significantly affect final profitability. A complete evaluation should separate fixed and variable costs while also considering operational costs throughout the product lifecycle. Ignoring these elements often creates unrealistic margin expectations and delayed investment recovery.
When should a business use a Manufacturing Cost and ROI Calculator instead of a basic spreadsheet?
A spreadsheet may be sufficient for simple purchasing decisions with stable products and predictable costs. However, more complex projects involving OEM development, multiple suppliers, international logistics, or significant upfront investment require a more integrated approach. A Manufacturing Cost and ROI Calculator becomes valuable when decision-makers need to connect product specifications, production assumptions, COGS, investment requirements, profitability forecasts, and ROI outcomes. The purpose is not to replace financial analysis but to reduce calculation gaps when multiple variables influence the final decision.
How does break-even analysis help compare different product development strategies?
Break-even analysis helps businesses compare strategies by showing how different investment structures affect capital recovery. For example, developing a fully customized product may create stronger differentiation but require higher upfront investment, while sourcing an existing product may reduce initial risk but offer less market control. The correct choice depends on demand certainty, available capital, competitive positioning, and expected lifecycle value. Businesses should use the analysis to understand trade-offs rather than searching for a single universally better approach.
Can break-even analysis be applied to businesses outside manufacturing?
Yes. Although manufacturing scenarios often involve more visible cost structures, the same decision logic applies to distributors, wholesalers, service providers, SaaS businesses, and other B2B models. Any business that commits resources before generating revenue can benefit from understanding the relationship between investment, operating costs, pricing, and required sales volume. The variables will differ by business model, but the underlying purpose remains the same: determining whether the expected commercial outcome justifies the resources allocated.
How often should companies update their product investment analysis?
Product investment analysis should be reviewed whenever major assumptions change rather than only at the beginning of a project. Important triggers include supplier price changes, material cost increases, logistics disruptions, revised customer demand, regulatory changes, or product modifications. Companies that treat the initial calculation as permanent may continue investing based on outdated assumptions. Regular reviews help procurement and commercial teams adjust sourcing strategies, pricing decisions, and production plans before financial risks become difficult to recover.
Conclusion
Product investment decisions require more than identifying market opportunities or negotiating lower supplier prices. The ability to understand cost structure, investment recovery requirements, and operational constraints determines whether a product can become a sustainable business opportunity. A structured evaluation process using break-even analysis, profitability modeling, and realistic cost assumptions allows decision-makers to identify risks earlier and allocate resources more effectively.
For businesses evaluating new products, expanding categories, or developing customized solutions, the next step is not simply increasing production volume but improving decision accuracy before capital is committed. Combining financial evaluation with practical sourcing strategies, supplier assessment, and manufacturing planning enables organizations to build repeatable investment decisions that support long-term growth and operational stability.